

Bitcoin faces sharp drop but maintains bullish structure
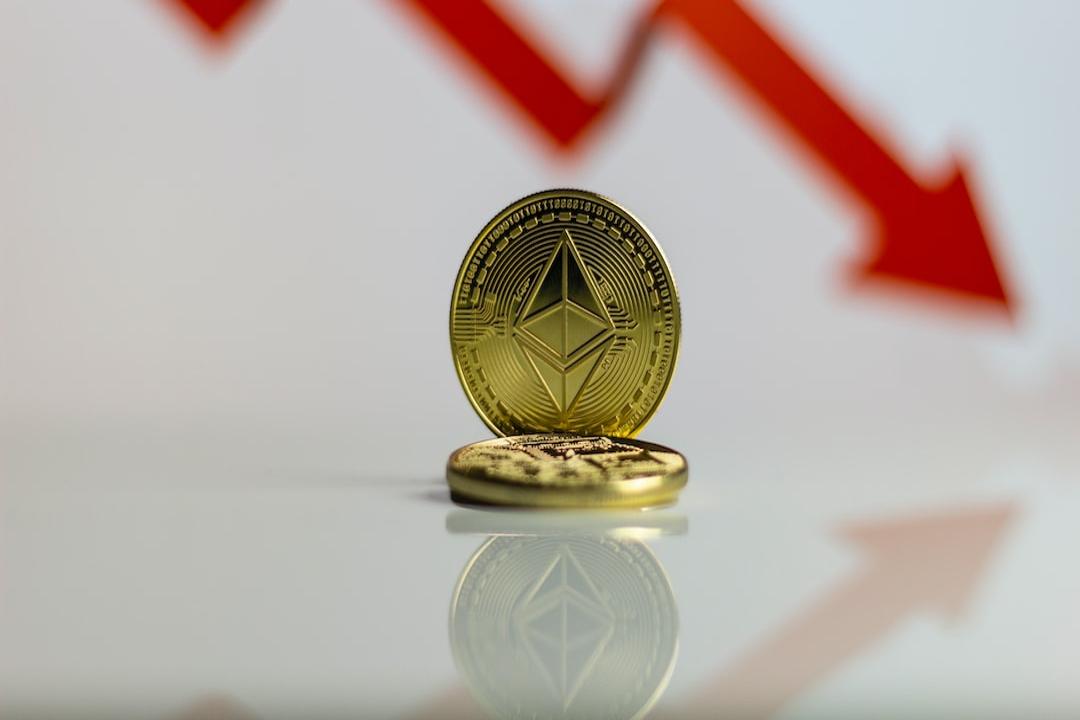
Bitcoin has experienced a major sell-off, falling nearly 111% from its Feb. 24 high of $96,500 to hit a three-month low of $86,050. Macroeconomic concerns, including weakening U.S. consumer confidence and President Trump’s impending trade tariffs, weighed on risk assets.
The BTC/USDT daily chart shows that Bitcoin is trading within a descending channel and is testing the key support level near $87,000. The Bollinger Bands suggest high volatility, with BTC hovering near the lower band of $90,373. The relative strength index (RSI) is 30.44, indicating oversold conditions, suggesting a possible rebound.
Analyst Titan of Crypto believes Bitcoin is forming a bullish inverse head and shoulders pattern, targeting $125,000 if support holds. However, Standard Chartered’s Geoffrey Kendrick warns that BTC could fall to $80,000 before recovering.
“Titan of Crypto,” a widely followed market analyst, believes that despite Bitcoin’s decline, its bullish structure remains intact. He noted that an inverse head and shoulders pattern on the weekly chart could push BTC towards $125,000.
Don Alt expressed similar optimism, saying that Bitcoin is only testing the range low and may rebound later. On the contrary, Standard Chartered analyst Geoffrey Kendrick warned that BTC could fall further and may hit the $80,000 level. Outflows from spot Bitcoin ETFs and increasing geopolitical risks indicate that the market is not ready to recover.

CryptoQuant reports 26,430 BTC ($2 billion) flowing into whale accumulation addresses, indicating that smart money is buying low. But fear is high in the market, with the Crypto Fear & Greed Index at a five-month low.
Chainlink (LINK) Breaks Below Key Support – Further Downside Possible Ahead?
Chainlink (LINK) has fallen to $15.26, down 15% in the past seven days. At the same time, whales have transferred up to 610,000 LINK tokens, increasing the selling pressure.

According to Santiment data, LINK ranks second in developer activity over the past 30 days, second only to the Internet Computer (ICP). The increase in development activity may boost investor confidence, but unless buying activity increases, LINK may remain under pressure.
Shiba Inu Coin risks breaking support, market sentiment weakens
Shiba Inu Coin (SHIB) has fallen in line with the broader market downtrend, dropping 7.55% in the past 24 hours to $0.00001423. The memecoin is hovering near a key support level, with 77 trillion SHIB tokens being bought at an average price of $0.00001.
Despite the weak price action, whale net inflows remain positive, with inflows exceeding outflows. IntoTheBlock data shows that whales have accumulated more than 443.78 billion SHIB tokens between February 20 and 23, showing the confidence of large holders.
However, the sharp drop in the burn rate - 95% below the previous level - indicates a drop in demand, raising concerns about SHIB's short-term performance.
SHIB’s historic rally in 2020-2021 has sparked speculation of another breakout. However, given the circulating supply of nearly 589 trillion tokens, replicating past gains seems unlikely. If sellers maintain control, SHIB could test the August 2024 low of $0.00001.